
 Figure 1 has been updated to reflect category changes to Hope Creek and Salem in New Jersey as well as Palo Verde in Arizona. As a result of laws passed in New Jersey on April 12, Hope Creek and Salem have been moved from the “in jeopardy” category to the “reprieved” category. Additionally, after an announcement by Arizona Public Service Company that Palo Verde nuclear station could close if the state amends its constitution to require utilities to get 50% of their energy from renewable resources, Palo Verde has been moved from the “operating plant” category to the “in jeopardy” category. Figure 1 will be refreshed to reflect modifications in plant categories as developments affect the prospects for certain units in the U.S. nuclear fleet.
Original Publish Date: April 6, 2018
The United States has embarked on actions to combat climate change by putting a focus on lowering the carbon emissions from the electric generation sector. A pillar of this approach is to promote the greater use of renewable resources, such as wind and solar. The past decade has seen significant growth in carbon-free energy from wind and solar. Generation from these resources reached 333,000 GWh in 2017. However, unbeknownst to many who care about climate change, most of the progress made to date through renewables is at significant risk due to the loss or potential loss of more than 228,000 GWh of nuclear carbon-free generation.
Over the past decade, wind and solar have grown in large part due to policies such as renewable portfolio standards, federal tax incentives, and in some cases state tax incentives. Few would argue that the addition of renewable generation is a critical element of a comprehensive carbon-reduction strategy.
Since 2008, the policy focus on renewables has attracted hundreds of billions of dollars of investment for the development of wind and solar. The results have been significant—in the past decade 90% of the current operating wind and solar capacity was added, to additions of roughly 75 GW of wind and 52 GW solar.1 Another result of these investments has been to help wind and solar drive down the cost curve reaching a more competitive position. The policies promoting renewables have clearly contributed to the addition of a meaningful amount of carbon-free electricity as well as to jump-starting an industry in the United States.
In the same timeframe, natural gas prices have driven down power prices, causing difficulties for both renewables and existing generation. The nuclear industry in particular has been challenged by low natural gas prices and the lack of overall policy support for its zero-carbon attributes. As a result, the nuclear industry has faced a wave of actual and announced retirements. The most vulnerable nuclear plants have been small, single-unit plants and merchant facilities in deregulated markets with low energy and capacity values. Under these conditions, existing nuclear plants are having difficulty competing in bid-based markets and in some regulated as well. Some states have recognized this issue and have explored zero-carbon incentives to keep plants open that would otherwise have shut down. However, these incentives are being challenged and still make these plants, while technically “reprieved,” what we categorize as “at risk.”
In 2016, the New York Public Service Commission approved a Clean Energy Standard (CES), which supported the continuation of more than 3 GW of nuclear capacity (i.e., Fitzpatrick, Ginna, and Nine Mile Point nuclear plants).2 In the same year, Illinois passed The Future Energy Jobs Bill that provides nuclear plants with $0.01/kWh, saving almost 3 GW of nuclear capacity (i.e., Clinton and Quad Cities nuclear plants).3 The actions in New York and Illinois sustained more than 50,000 GWh of carbon-free generation per year. Meanwhile, Connecticut recently estimated it would cost roughly $5.5 billion to replace the carbon-free generation from Dominion Energy’s Millstone station with renewables.4
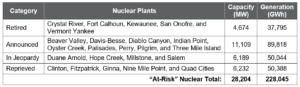
To understand the potential for loss of carbon-free generation, ScottMadden identified four categories of “at-risk” nuclear assets. Each nuclear plant operating in 2008 (a date that coincides with the rapid growth in renewables) was reviewed and, if applicable, placed into one of the following “at-risk” categories:
For each “at-risk” category, we calculated total capacity and annual generation.5 As seen in the table below, more than 28,000 MW of nuclear capacity has retired or is facing early retirement. The 228,045 GWh of nuclear generation retired since 2008 or at risk of early retirement represents 5.6% of total U.S. net generation in 2016.
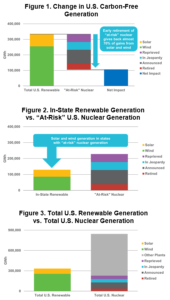
When compared on energy output, the potential loss of nuclear presents a greater concern. With capacity factors greater than 90%, losing a smaller amount of nuclear can produce outsized impacts on carbon-free generation compared to the low-capacity factor of wind and solar (35% to 22%).7 In 2017, wind and solar produced a combined total of 333,000 GWh of carbon-free generation (see Figure 1). This gain has the potential to be reduced by 68% or 228,045 GWh through the early retirement of nuclear capacity. In fact, the United States has lost 11% of the renewable generation from plants already retired.
In the states that host “at-risk” nuclear assets, the potential lost carbon-free generation from nuclear energy exceeds total in-state renewable energy generation (see Figure 2).8 This represents a significant barrier to achieving near-term state-level reductions in greenhouse gas emissions.
A further potential challenge is the relicensing of nuclear plants. Those plants not currently at risk of early retirement must renew their operating licenses with the U.S. Nuclear Regulatory Commission in the next 20 years. If these plants do not renew their licenses, even more carbon-free generation would be lost. In fact, wind and solar output would need to more than double just to break even on the loss of carbon-free generation from the retirement of the entire nuclear fleet (see Figure 3).
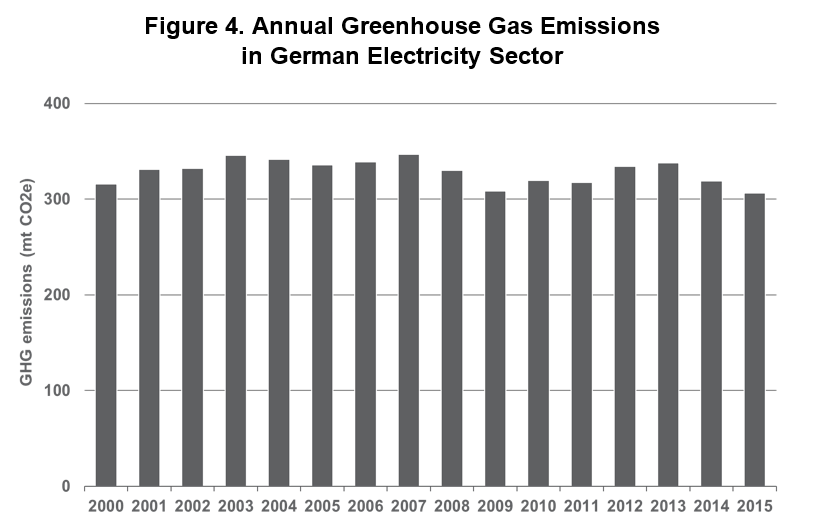 Many have pointed to Germany as a shining example of a country that has led the way in deploying renewables. In 2000, the Renewable Energy Act established feed-in tariffs and priority grid access for renewables. The action represents a key milestone in the Energiewende or transition to a low-carbon economy based on renewable resources. Since then, the country has spent roughly $222 billion on renewable subsidies.9 The result is renewable energy as a percentage of gross electricity generation increasing from 6.2% in 2000 to 31.3% in 2015.10
At the same time however, Germany has embarked on a strategy of shuttering its nuclear plants. Roughly 40% of the country’s nuclear capacity was shut down in 2011, following the Fukushima nuclear accident.11 As a result, despite the addition of significant renewable resources, there is limited progress in reducing total carbon emissions in the electricity sector due to the early retirement of nuclear plants. In fact, greenhouse gas emission from the electricity sector has only decreased 3% from 2000 to 2015 (see Figure 4).12
Investments in renewables have made a significant contribution to emission-free electricity generation. For those concerned with climate change, this represents a meaningful step in the right direction. The early retirement of “at-risk” nuclear, however, puts the United States in danger of “giving back” an amount equivalent to two-thirds of the overall carbon-free generation supplied from wind and solar. In states with these nuclear assets, the loss represents a significantly larger impact. The losses could become even greater if more nuclear plants do not renew operating relicenses.
However, a glimmer of hope emerges as states, such as New York and Illinois, are developing policies to value the carbon-free generation provided by nuclear plants. Even environmentalists are beginning to offer support for nuclear energy. In Illinois, the Union of Concerned Scientists called the Future Energy Jobs Bill “one of the most comprehensive state energy bills ever crafted and is the most important climate bill in Illinois history.”13 In addition, an open letter signed by more than 70 ecologists and conservation researchers stated that wind and solar are promising, but “nuclear power—being by far the most compact and energy dense of sources—could also make a major, and perhaps leading, contribution” to carbon emission reductions.14
If nuclear plants are not saved in the near term, it will put the entire industry at risk. For once a nuclear plant shuts down, it will not come back. If enough nuclear plants shut down, a tipping point may be reached for the entire industry in the United States, and we will lose forever that carbon-free generation. While one might argue that in the long run, this nuclear hole may be filled with renewables and other evolving clean technologies, in the near term it is certain that a rapid and deep carbon reduction will require these nuclear assets.
Additional Contributing Authors: Paul Quinlan, Benjamin Lozier
This report is one of a series of ScottMadden white papers on clean energy technologies and is based on our independent analysis. The contents have been updated from the initial version to reflect the recent change of FirstEnergy Solutions units from “in jeopardy” to “announced.”
[1] Data obtained from Bloomberg New Energy Finance’s 2018 Sustainable Energy in America Factbook. Wind capacity is reported in AC; solar capacity is reported in DC.
[2] New York State Department of Public Service, Governor Cuomo Announces Establishment of Clean Energy Standard that Mandates 50 Percent Renewables by 2030.
[3] Forbes, Illinois Sees The Light – Retains Nuclear Power. December 4, 2016.
[4] Connecticut Department of Energy & Environmental Protection Connecticut Public Utilities Regulatory Authority, Resource Assessment of Millstone Pursuant to Executive Order No. 59 and Public Act 17-3; Determination Pursuant to Public Act 17-3. February 1, 2018.
[5] Capacity was calculated using net summer peak capacity obtained from SNL Financial. Generation was calculated using 92.3% capacity factor, which represents the average capacity factor for the U.S. nuclear fleet in 2016 as reported by the Energy Information Administration.
[6] Data obtained from Bloomberg New Energy Finance’s 2018 Sustainable Energy in America Factbook. Wind capacity is reported in AC; solar capacity is reported in DC.
[7] Average capacity factor of utility-scale generators in 2016: nuclear 92.3%, wind 34.5%, utility-scale solar 25.1%, and solar thermal 22.2%. Source: Energy Information Administration, Electric Power Annual. Distributed solar capacity factors are often below 20%.
[8] These states include California, Connecticut, Florida, Illinois, Iowa, Massachusetts, Michigan, Nebraska, New Jersey, New York, Ohio, Pennsylvania, Vermont, and Wisconsin.
[9] The New York Times. Germany’s Shift to Green Power Stalls, Despite Huge Investments. October 7, 2017.
[10] German Environment Agency on the basis of Working Group on Renewable Energy Statistics (AGEE-Stat)
[11] The Economist. Is Germany’s Energiewende Cutting GHG Emissions? March 20, 2017.
[12] United Nations Framework Convention on Climate Change Data Interface
[13] Union of Concerned Scientists. A Huge Success in Illinois: Future Energy Jobs Bill Signed Into Law. December 8, 2016.
[14] The Washington Post. Why Climate Change Is Forcing Some Environmentalists to Back Nuclear Power. December 16, 2014.
View MoreSussex Economic Advisors is now part of ScottMadden. We invite you to learn more about our expanded firm. Please use the Contact Us form to request additional information.