

Picture this: A repair or replacement part is not on hand when needed, thus creating additional problem-solving and expediting efforts to get your unit or asset back online safely. Assuming you have experienced a similar situation, you may have thought to yourself, “If we only had more material in our warehouse, we wouldn’t have these shortages.” Sound familiar?
The lack of on-hand material for maintenance work can impact overall efficiency and effectiveness, which can affect operating performance (in the plant or in energy delivery field operations).
Leveraging statistical analysis of data compiled by the Utility Material Management Benchmarking Consortium (UMMBC) 2015 Warehouse Survey, ScottMadden examines whether material availability (inventory stockout rates) impacts operating performance and to what degree. This report, the second in a four-part series, offers insight into best practices for improving material availability.
Be sure to check out all of the articles in this series.
FULL ARTICLE
Anyone dealing with system maintenance has a story about a repair or replacement part that was not on hand when needed. In most of these stories, a herculean expediting and troubleshooting effort results in the unit or asset getting back online safely. Given this experience, there is a tendency to think, “If we only had more material in our warehouse, we wouldn’t have these shortages.” This article is the second in a series of articles examining common inventory management questions using statistical analysis of data compiled by the Utility Materials Management Benchmarking Consortium (UMMBC)[1] in their 2015 warehouse survey. This survey collected detailed data from 286 warehouses operated by 19 leading utilities.
In the previous article, we examined the question of whether having more inventory on hand improves material availability. Statistical analysis demonstrates that it does, but not by much. This article examines another common question, “Does material availability (inventory Stockout Rates) impact operating performance?” The assumption is that the lack of material when needed for maintenance work will impact maintenance efficiency and effectiveness which, in turn, will impact operating performance—whether in the plant or in energy delivery field operations. This connection seems logical, but just how much impact does material availability actually have? Let’s see what the data tells us.
Stockout Rates
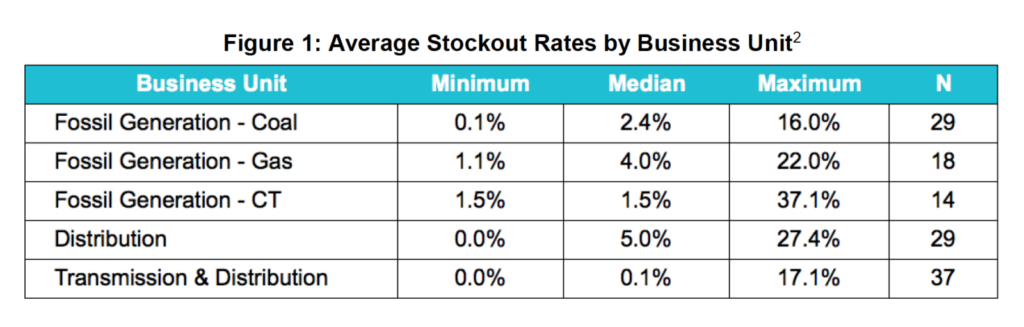
In the 2015 survey, participants were requested to provide average Stockout Rates for the prior year as a measure of material availability. The Stockout Rate was defined as the percentage of items not available upon the requested need date. As shown in Figure 1, the resulting data indicated that median Stockout Rates were relatively low across all business units ranging from a low of 0.1% in combined transmission and distribution (T&D) warehouses to a high of 5.0% in distribution-only warehouses. Unfortunately, less than half of the warehouses in the study were able to report their Stockout Rates, which to some extent is instructive in that many utilities do not accurately track this important measurement.
Stockout Rate versus Generation Operating Performance
Armed with this data, the ScottMadden research team developed a series of correlations and regression equations using Generation Operating Performance (defined as EFOR) as the dependent variable and the Stockout Rate as the independent variable. The correlation plot for all warehouses aggregated across all generation business units is shown in Figure 2.
Figure 2: Correlation between Stockout Rate and Generation EFOR
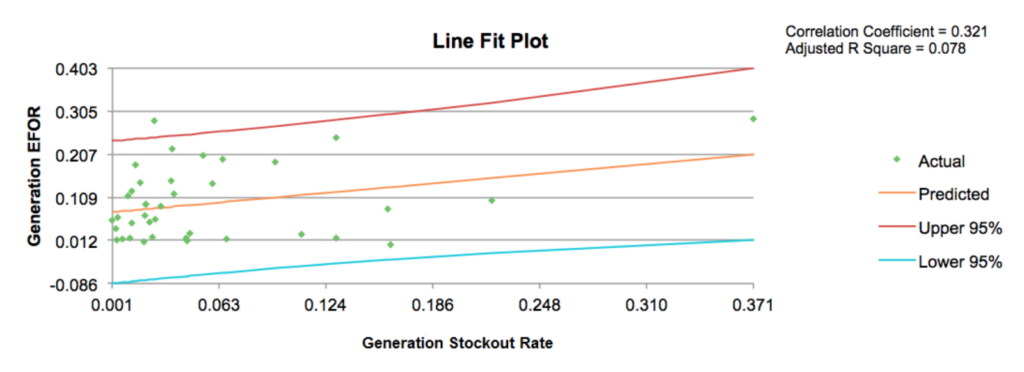
Overall, the relationship between inventory Stockout Rates and Operating Performance measured as EFOR is positive and relatively significant. As expected, plants with higher Stockout Rates do have higher Forced Outage Rates. In fact, 7.8% of the variation in Total Generation EFOR can be attributed to the plant’s inventory Stockout Rate. The relationship is most noticeable within gas plants but holds true overall.
Stockout Rate versus Distribution Operating Performance
The ScottMadden research team also developed a series of correlations and regression equations using Distribution Operating Performance (defined as SAIDI) as the dependent variable and the Stockout Rate as the independent variable. The results are shown in Figure 3.
Figure 3: Correlation between Stockout Rate and Distribution SAIDI
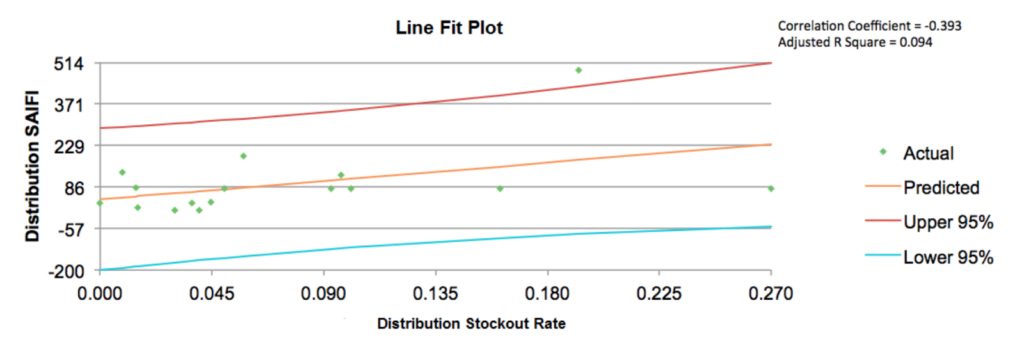
We found a relatively strong relationship between Stockout Rates and the duration of system interruptions (SAIDI). Stockout Rates correlate with SAIDI scores and explain 14.9% of the variation in SAIDI—a relationship which is large enough to be significant. Poor performance in parts fulfillment does appear to have some impact on how fast system interruptions are corrected, therefore the average duration of those interruptions.
Conclusions
As expected, statistical analysis supports our expectation that higher Stockout Rates are associated with reduced Operating Performance—both in generation and distribution. The results are more robust with respect to generation insofar as the number of observations is greater (38 compared to 16), and the causal inference between the warehouse and the plant is more direct. The team’s findings with respect to distribution are less robust given the relatively small sample size and the fact that individual warehouses are not as clearly associated with regions reporting SAIDI scores. However, the correlation between Stockout Rates and distribution SAIDI scores is intriguing and merits further research.
Keep in mind that operating performance is influenced by a wide range of variables, ranging from equipment configuration, maintenance practices, and operating conditions to name a few. This article examines a single variable in isolation and does not control for the influence of all the others. That analysis will have to wait for future researchers with access to more data.
SCOTTMADDEN SUPPLY CHAIN SUPPORT
ScottMadden’s long history of working with electric utilities and other asset-intensive companies and deep understanding of the key performance levers in supply chain gives us a clear lens through which to view efficiency and effectiveness. Additionally, ScottMadden’s proven methodology to uncover the true drivers of inventory levels and develop realistic improvement plans is the most comprehensive approach in the industry. We encourage you to learn more about our capabilities and opportunities to optimize your inventory levels.
To learn more about ScottMadden’s supply chain practice, please contact us.
About ScottMadden’s Energy Practice
We know energy from the ground up. Since 1983, we have been energy consultants. We have served more than 300 clients, including 20 of the top 20 energy utilities. We have performed more than 2,400 projects across every energy utility business unit and every function. We have helped our clients develop strategies, improve operations, reorganize companies, and implement initiatives. Our broad and deep energy utility expertise is not theoretical—it is experience based.
[1] The UMMBC was established in 2007 and currently consists of 56 leading utilities who periodically collaborate to develop information needed to critically examine and improve ongoing warehouse and inventory management operations in the Electric & Gas Utility Industry. Members participate in individual surveys on a voluntary basis. Comprehensive warehouse surveys were conducted in 2008, 2011, and 2015.
[2] Not all warehouses measure or were able to report average Stockout Rates. Nuclear and Hydro warehouses are excluded. “N” refers to the number of warehouses for which this data was submitted.
[3] Source: The Generating Availability Data System (GADS), North American Electric Reliability Corporation (NERC).
[4] According to IEEE Standard 1366-1998, the median value for North American utilities is approximately 1.50 hours.

Sussex Economic Advisors is now part of ScottMadden. We invite you to learn more about our expanded firm. Please use the Contact Us form to request additional information.