In December 2020, ScottMadden’s Brad DeMent and Trey Robinson delivered a webinar to discuss the results of the latest APQC finance shared services benchmarking study. The study was designed by ScottMadden and surveys were administered by APQC over five cycles: Spring/summer 2014; spring/summer 2015; summer/fall 2016; spring/summer 2018; and summer 2020. The scope of the finance shared services study included delivery model, scope of services, staffing, location, performance, and technologies leveraged. Results from 200 organizations from the last two cycles were shared during the webinar.
Drawing from the results of the survey, this article highlights the study’s key findings regarding governance, structure, and scope for finance Shared Services Centers (SSCs), including:
Access the complete article series here.
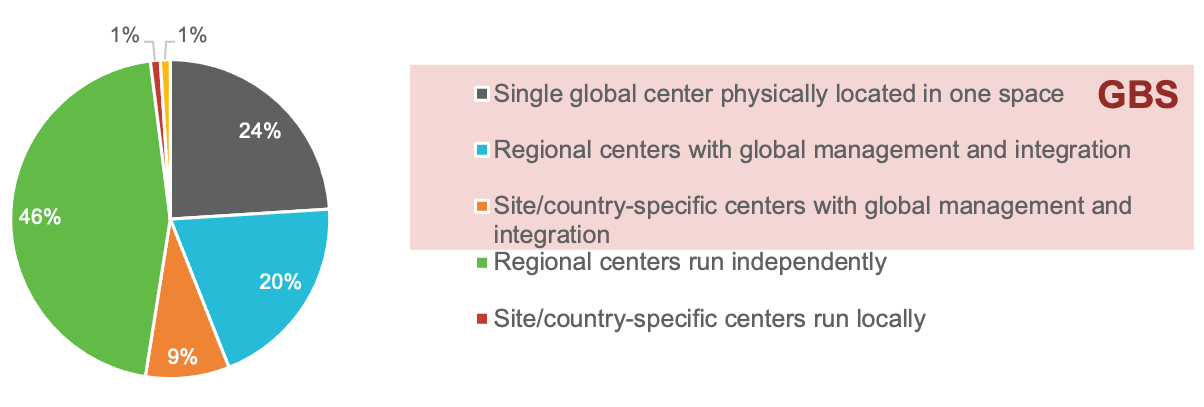
A majority of organizations surveyed (53 percent) reported using a Global Business Services (GBS) model for finance shared services. Some of these organizations (24 percent) leverage a single global center that is physically located in one space, while others leverage regional centers with global management and integration (20 percent), or site/country-specific centers with global management and integration (9 percent). The remaining organizations leverage regional centers run independently (46 percent) or site/country-specific centers run locally (1 percent).
Figure 1: Shared Services: Geographic Model

A majority of SSCs (65 percent) report to a finance executive like the CFO, while about a quarter (24 percent) report to a multi-function shared services executive. DeMent said that 64 percent of respondents leverage the global process owner role, and about half leverage formal service level agreements to govern shared services.
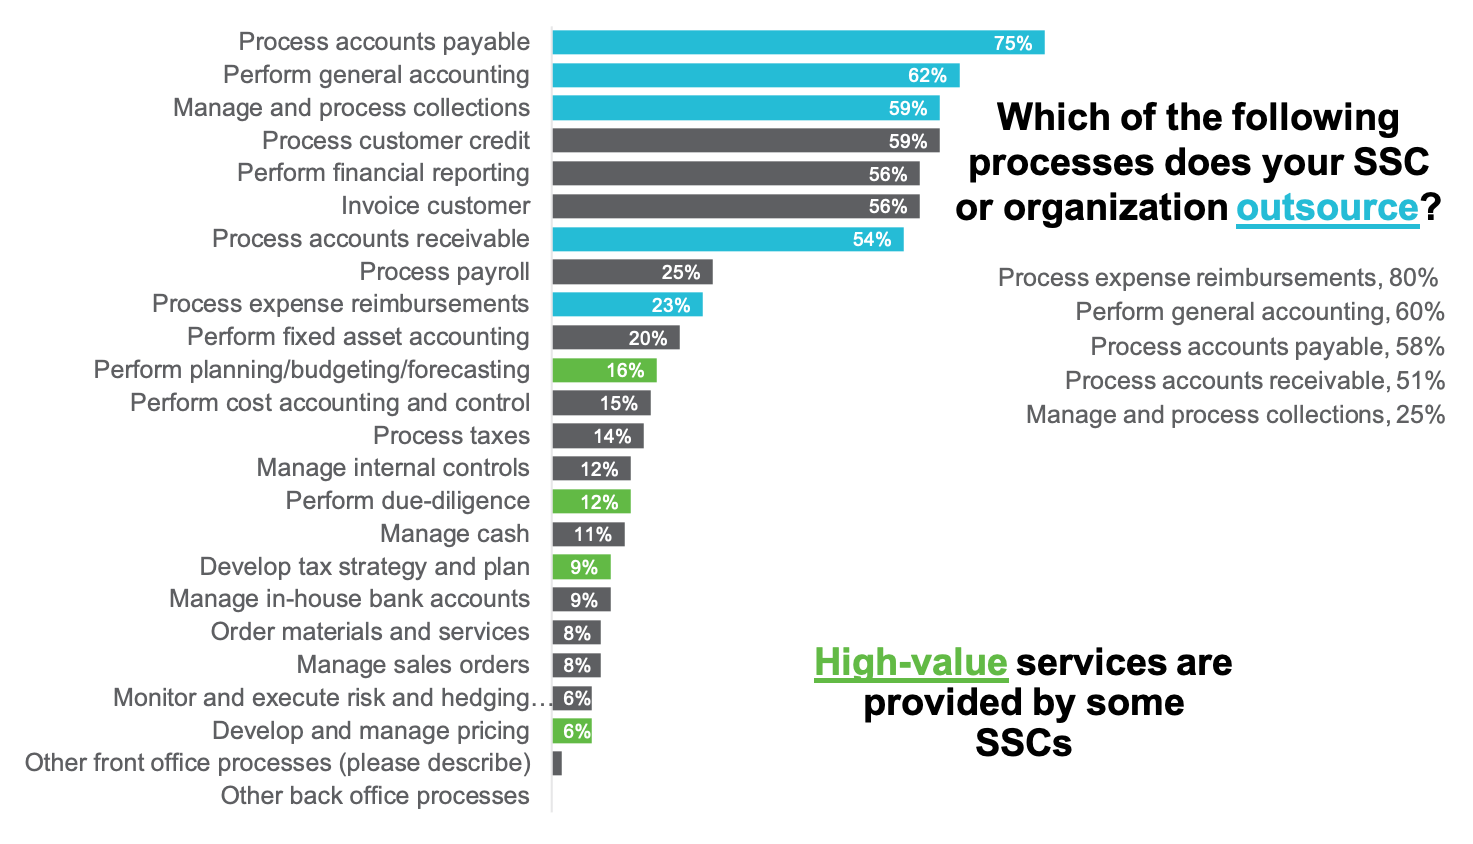
For many organizations, the scope of shared services includes high-volume, transactional processes like accounts payable, accounts receivable, and general accounting. DeMent also noted that processes related to Order-to-Cash (O2C) like collections and customer credit have been rising in the last year, possibly as the result of the COVID-19 pandemic (Figure 2). DeMent offered further insights related to this finding: “As companies dealt with the negative financial impacts from COVID-19 and became more cash-constrained, there was more emphasis placed on the O2C processes,” said DeMent. “Customer credit analysis was flipped upside down as the risk of non-payment from historically sound customers changed and standard credit formulas quickly became meaningless. Collections staff worked overtime to cull overdue payments with increased pressure and implemented innovative tools to better predict payment behaviors and probabilities. Conversely, some industries that benefited with cash windfalls turned their attention to fixing lingering cash application bottlenecks.”
Figure 2: Which of the following processes are in-scope for your SSC?

Organizations are increasingly outsourcing processes that are typically within the scope of shared services, including expense reimbursements (80 percent of respondents), general accounting (60 percent), accounts payable (58 percent), accounts receivable (51 percent) and collections (25 percent). Outsourcing these processes frees up time for SSCs to focus on providing more value-added services like planning/budgeting/forecasting (16 percent of respondents), performing due diligence (12 percent), and developing and managing pricing (6 percent).
Consistent with data from previous survey cycles, processes with the highest degree of global centralization include transactional processes like accounts payable (33 percent), general accounting (32 percent), and accounts receivable (29 percent; Figure 3). Although planning/budgeting/forecasting and processing taxes are the least standardized processes for SSCs, DeMent said that global centralization has increased for these processes relative to previous years.
DeMent offered some further insights related to the study findings on process centralization: “Centralization followed by standardization and automation has historically delivered savings of 25 percent to 35 percent of administrative cost―More in GBS Models that take advantage of labor arbitrage in low-cost locations,” said DeMent. “Once CFOs witness this reality from peers or competitors, it’s hard to unsee. However, the pandemic has fast tracked the speculation of whether or not SSCs and global hubs could thrive in Work-From-Home (WFH) models. The mantra has now become ‘centrally-governed’ versus ‘centrally-located. The traditional ‘model’ is being tested, and thus far passed. Even so, organizations are placing constraints on the WFH model (e.g., working within driving distance to the office) to hedge potential long-term negative effects of WFH, such as cultural and work relationship impacts.”
Figure 3: Process Centralization

Most SSCs have adopted one or more end-to-end (E2E) processes, the most common of which are procure-to-pay and record-to-report. Both of these E2E processes have become more common in SSCs than they were four years ago (Figure 4). Order-to-cash has remained relatively stable, which DeMent said is likely because the process is harder to organize and spans more departments.
Figure 4: Which of the following end-to-end processes are in-scope for your shared services center?

A majority of organizations implement E2E processes like record-to-report and order-to-cash either before or at the same time as a shared services implementation (Figure 5). DeMent noted that many organizations are aligning procure to pay even outside the context of an SSC through governance or hard line reporting.
Figure 5: Did you implement E2E processes before, during, or after shared services implementation?

A large majority of organizations (86 percent) reported that questions from employees, contractors, vendors, or other internal and external finance customers are channeled to a dedicated group of finance employees. In top-quartile organizations, nearly a quarter of finance employees (22 percent) are dedicated to addressing and resolving these customer care inquiries through a formal ‘problem desk’ or customer care center (Figure 6). DeMent recommends dedicated customer service channels for any SSC that does not yet have them to ensure that customer inquiries can be appropriately triaged and tracked in a standardized way. Organizations in the top quartile that leverage these structures have a first-contact resolution rate of 85 percent, nearly ten percent higher than the bottom quartile (76 percent).
Figure 6: Total number of finance employees dedicated to ‘problem desk’ or ‘customer care’ inquiries as a percentage of finance shared services center employees

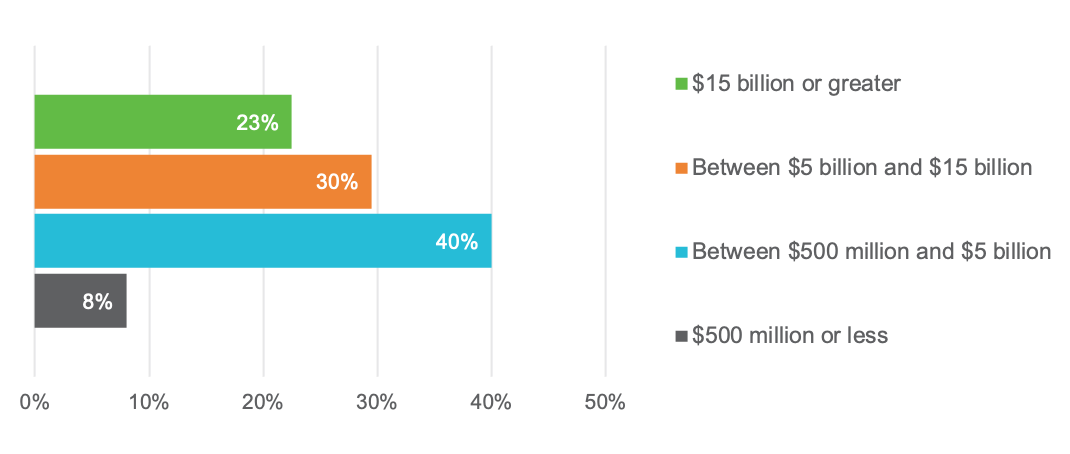
The results summarized represent 200 participating organizations from the US or Canada. Company size is balanced across the revenue profile (Figure 7), with median revenue of $11.9 billion. Most organizations (87 percent) have been operating over three years, and more than half (55 percent) have been operating for over five years.
Study Population: Business Entity Revenue

Sussex Economic Advisors is now part of ScottMadden. We invite you to learn more about our expanded firm. Please use the Contact Us form to request additional information.