

Higher warehouse staffing can be attributed to a variety of factors. We have narrowed in on four variables or potential contributing factors and reviewed their relationship with staffing needs.
Find out which drivers contributed most to higher staffing requirements by accessing this complimentary report that leverages data from the Utility Materials Management Benchmarking Consortium (UMMBC) 2015 Warehouse Survey.
ScottMadden is a founding member of the UMMBC and has been conducting independent research studies on behalf of the consortium since 2007. ScottMadden has been assisting leading utilities with improving their supply chain operations for more than 20 years. Contact us to learn more about how to efficiently manage your warehouses.
Be sure to check out all of the articles in this series.
FULL ARTICLE
This article is the fourth in a series of articles examining common inventory management questions using statistical analysis of the data compiled by the Utility Material Management Benchmarking Consortium (UMMBC)[1] in their 2015 warehouse survey. This survey collected detailed data from 286 warehouses operated by 19 leading utilities. The questions examined in the prior articles were:
The current article seeks to answer a fourth question, “What factors contribute the most to higher warehouse staffing?” The data used for this analysis were the survey results for 129 warehouses drawn from all utility business segments with the exception of hydro and nuclear generation.[2]
In examining this question, the research team defined warehouse staffing as “Total Warehouse Staff in Full-time Equivalents (FTEs)” as the dependent variable.[3] The following factors were selected as independent variables—or potential contributing factors to higher warehouse staffing:
Correlation Analysis
The team began by examining the relationship of each independent variable to the dependent variable. The tool used for this purpose was correlation analysis. Correlation is a statistical technique used to measure and describe the strength and direction of the relationship between two variables. A positive correlation indicates the extent to which those variables increase or decrease in parallel, while a negative correlation indicates the extent to which one variable increases as the other decreases.[5] Correlation coefficients can range from -1.0 to +1.0, depending upon the strength and direction of the relationship. The correlation coefficients for the variables described above are presented in the figure below.
Correlations between Total Warehouse Staff and Selected Warehouse Variables[6]
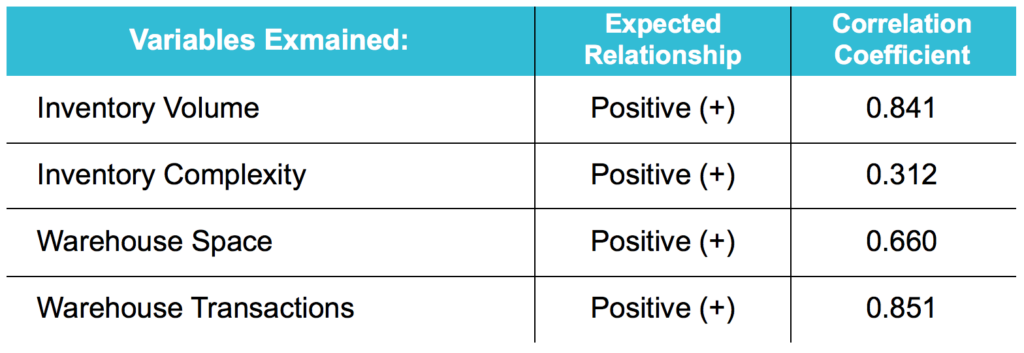
The above correlation coefficients indicate that all of the variables examined contribute positively to higher warehouse staffing:
The strength of the relationships varies according to the variable examined as shown by their correlation coefficients. The factors most highly correlated were Inventory Volume and the number of Warehouse Transactions.
Multiple Regression Analysis
Having examined the individual relationship between each of the variables and inventory levels, the research team then attempted to examine the combined impact of all four variables working together. The tool used for this purpose was multiple regression analysis.[7] Multiple regression is a statistical technique used to document the relationship between one dependent variable and several independent variables operating in unison. It attempts to measure the individual impact of each variable after controlling for any correlations between the variables themselves.
When viewed as a consolidated model, the four variables taken together “explain” 84.6% of the variation in warehouse staffing based upon the value of the Adjusted R Square.[8] The predictive formula is:
Y = 1.238 + 0.371X1 – 96,357X2 + 20.186X3 + 95.954X4
Where:
Y = Total Warehouse Staffing in FTEs
X1 = Inventory Volume (* 1,000,000)
X2 = Inventory Complexity (* 1,000,000)
X3 = Warehouse Space (*1,000,000)
X4 = Warehouse Transactions (*1,000,000)
With all our quantitative drivers of work accounted for, our model still leaves approximately 15% of the variation in staffing levels unaccounted for. We can only speculate what those factors might be, but logical possibilities include the efficiency of the company’s warehouse practices, the company’s overall approach to human resources management, and the influence of any bargaining unit rules or agreements in effect.
Conclusion
To the best of our knowledge, the analysis described in this article is the first attempt to model quantifiable factors that may contribute to warehouse staffing levels in the electric utility industry. The results indicate that quantitative workload variables explain approximately 85% of the variation in staffing levels. Specifically, the following variables were found to contribute to higher warehouse staffing:
Approximately 15% of the variation in warehouse staffing levels is not explained by any of these direct, or indirect, quantitative drivers of workload. Other “softer” factors also appear to be in play. For instance, our experience suggests that staffing levels at a utility warehouse are typically driven by some combination of current budgeting challenges, perceptions of work capacity, and/or legacy labor requirements. We have rarely encountered a utility warehouse that staffs its personnel based on productivity expectations/targets or other labor management practices commonly utilized in other industries, such as commercial/industrial warehousing. If your utility operates differently, please let us know as we are constantly seeking to identify leading practices.
SCOTTMADDEN SUPPLY CHAIN SUPPORT
ScottMadden’s long history of working with electric utilities and other asset-intensive companies and deep understanding of the key performance levers in supply chain gives us a clear lens through which to view efficiency and effectiveness. Additionally, ScottMadden’s proven methodology to uncover the true drivers of inventory levels and develop realistic improvement plans is the most comprehensive approach in the industry. We encourage you to learn more about our capabilities and opportunities to optimize your inventory levels.
To learn more about ScottMadden’s supply chain practice, please contact us.
[1] The UMMBC was established in 2007 and currently consists of 56 leading utilities that periodically collaborate to develop information needed to critically examine and improve ongoing warehouse and inventory management operations in the electric & gas utility industry. Members participate in individual surveys on a voluntary basis. Comprehensive warehouse surveys were conducted in 2008, 2011, and 2015.
[2] Replies for all five variables examined were not provided by the nuclear warehouses responding to the study.
[3] Warehouse Staff includes Warehouse Management, Materials Management Analysts and Coordinators, Materials Management Storekeepers, Material Handlers, Materialmen and Materials Management (tool room personnel), Materials Quality Control, and Administrative personnel.
[4] Total On-Site Material includes (1) FERC 154 Inventory, (2) Capitalized Materials and (3) Consigned Materials. Most On-Site-Material is FERC 154 inventory. Capitalized material is material on hand that has no dollar value in inventory insofar as it was expensed to projects upon acquisition. Consigned material is owned by third parties but held at the utility’s warehouse.
[5] In preparing this analysis, the research team used the Pearson product-moment correlation coefficient, which measures the strength of the linear association between variables. Line plots were examined in each case to determine if a non-linear relationship might exist.
[6] The total number of warehouses for which all five variables could be found was 67 of the original 286.
[7] Multiple linear regression (MLR) is a statistical technique that used several explanatory variables to predict the outcome of a response variable. The goal of MLR is to mode the relationship between the explanatory and response variables.
[8] R-squared measures the proportion of the variation in the dependent variable (Y) explained by the independent variables (Xn) for a linear regression model. Adjusted R-squared adjusts the statistic based upon the number of independent variables in the model.
View More
Sussex Economic Advisors is now part of ScottMadden. We invite you to learn more about our expanded firm. Please use the Contact Us form to request additional information.